- Research article
- Open access
- Published:
Optimal, minimax and admissible two-stage design for phase II oncology clinical trials
BMC Medical Research Methodology volume 20, Article number: 126 (2020)
Abstract
Background
The article aims to compare the efficiency of minimax, optimal and admissible criteria in Simon’s and Fleming’s two-stage design.
Methods
Three parameter settings (p1-p0 = 0.25–0.05, 0.30–0.10, 0.50–0.30) are designed to compare the maximum sample size, the critical values and the expected sample size for minimax, optimal and admissible designs. Type I & II error constraints (α, β) vary across (0.10, 0.10), (0.05, 0.20) and (0.05, 0.10), respectively.
Results
In both Simon’s and Fleming’s two-stage designs, the maximum sample size of admissible design is smaller than optimal design but larger than minimax design. Meanwhile, the expected samples size of admissible design is smaller than minimax design but larger than optimal design. Mostly, the maximum sample size and expected sample size in Fleming’s designs are considerably smaller than that of Simon’s designs.
Conclusions
Whenever (p0, p1) is pre-specified, it is better to explore in the range of probability q, based on relative importance between maximum sample size and expected sample size, and determine which design to choose. When q is unknown, optimal design may be more favorable for drugs with limited efficacy. Contrarily, minimax design is recommended if treatment demonstrates impressive efficacy.
Background
Phase II clinical trials are carried out to provide preliminary efficacy assessments of a new drug or therapy. In clinical research, phase II trials are inevitably essential for drug/therapeutic developments. They act as screening tools to discontinue ineffective drugs or warrant promising new drugs for future evaluation. Phase II trials typically employ various dosages to evaluate efficacy and safety in patients with malignant tumors. Therefore, researchers could design phase II trials to target at sensitive cancer, delimit a safety range of dosing, and outline appropriate administrations. In this sense, phase II trials may provide supportive evidence to conduct phase III trials.
Merits have been discussed in detail by Gan and Grothey [1] concerning single-arm phase II (SA-II) trials vs. randomized phase II (RP-II) trials (include both experimental and standard therapy arms). SA-II trials are found to be more preferable for single agents with tumor response end points. One of the frequently used designs in phase II cancer clinical trials is single-arm two-stage design proposed by Simon in 1989 [2]. Simon’s design has been proved to be a compelling method in initial efficacy evaluation. Based on the ethical requirement [1], once efficacy of a drug/treatment does not reach the predefined criterion in a proof-of-concept trial, the experiment will be terminated for futility to avoid more individuals accepting ineffective treatment.
One of the important advantages of single-arm phase II trials is that they involve much smaller sample size than their randomized phase II counterparts. Therefore, single-arm trials always require less time to complete and less resources invested [3]. Several studies, aiming to improve single-arm phase II clinical trials, have been employed in recent years. Shan et al. utilized results in first stage to help calculate the second stage sample size [4]. Besides, they also proposed to construct one-sided lower limits for analyzing data in adaptive phase II trials [5]. Jung and Sargent first attempted to adopt Fisher’s exact design in randomizing phase II trials [6]. Khan et al. proposed to control sample size by slightly relaxing type I error [7]. Among these, a single-arm multi-stage testing procedure, proposed by Fleming [8], is appealing. He suggested to early stop the experiment when the intermediate results are extreme, either in favor of efficacy or futility. Compared to Simon’s design, early acceptance of the drug is permitted here.
Although progression free survival is regularly used in early oncology trials, the proportion of patients whose tumors marked shrinkage is also considered as an important metric in most phase II trials [9]. Amongst all two-stage trials with dichotomous endpoints, there are many designs satisfying a type I and II error constraint, given both the upper boundary to stop the trial and lower boundary to continue the trial. Thus, Simon proposed two criteria (minimax, optimal) to estimate sample sizes. Minimax design mainly aims to minimize the maximum sample size. Alternatively, optimal design aims to minimize the expected sample size. Shuster and Mander and Thompson further extended two Simon’s criteria in their optimal designs that allow early stopping for efficacy [10, 11]. However, one limitation of two Simon’s designs is that the minimax and optimal designs may result in highly divergent sample size requirements. Based on a Bayesian decision-theoretic criterion, Jung et al. proposed a family of admissible designs that are compromises between the two Simon’s designs [12, 13].
This article attempts to systematically compare minimax, optimal and admissible criterions in both Simon and Fleming’s two-stage designs. The rest of the paper is arranged as follows. In section 2, the conception of Simon’s optimal and minimax two-stage design, as well as Fleming’s two-stage design and Jung’s admissible design are reviewed. In section 3, a variety of design parameters are used to illustrate estimated sample sizes based on three criterions in both Simon and Fleming’s two-stage designs. In section 4, a practical example is adopted to help explain the merits of Simon’s two-stage design, Fleming’s two-stage design and admissible design. In section 5, the recommendations and implementations of optimal, minimax and admissible design are discussed.
Methods
Consider a single-arm design with tumor response rate as the primary endpoint, where a binary outcome is defined as either “response” or “no response”. We want to test the hypotheses:
with type I error rate α and type II error rate β. Here p denotes the true response rate, p0 is a fixed value that denotes the maximum response probability in order to terminate trial early. In practice, we will define p = p1 in the alternative hypothesis to represent the minimum response probability to warrant further studies in subsequent trials, therefore, the power of the test will be calculated at p = p1 > p0. If the null hypothesis is rejected, the study will be extended to phase III stage, given the warranted therapeutic efficacy. Otherwise, the study will be terminated, given the insufficiently promising efficacy.
Simon’s two-stage design
A most widely used two-stage design is proposed by Simon [2]. Two different two-stage designs are introduced that allow early trial termination for futility. Details are illustrated in Fig. 1. In the figure, we define.
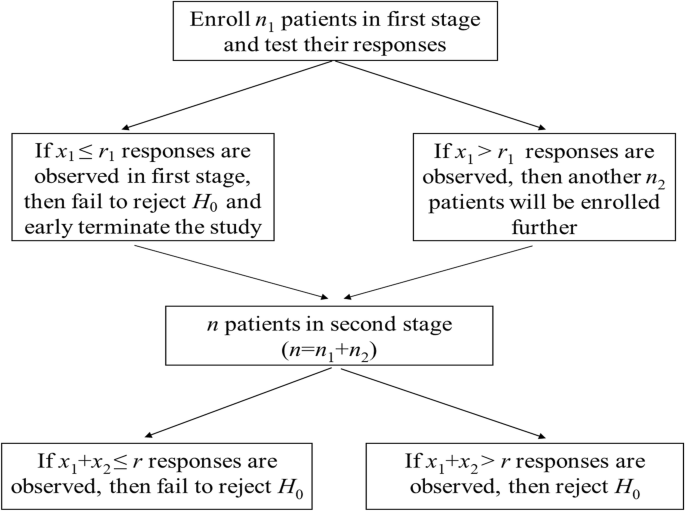
Flowchart for Simon’s two-stage design
n1, n2: the number of subjects in the first and second stage, respectively, and n = n1 + n2;
x1, x2: the number of responses observed in the first and second stage, respectively;
r1, r: the number of rejection points (under H0) in the first and second stage, respectively.
Thus, the probability of early termination (PET) at the end of first stage (under null hypothesis) is
where suffix S is used to represent the result of Simon’s design. Consequently, the probability of rejecting the treatment is
Here b(x;p,n) and B(x;p,n) are the probability mass and cumulative binomial distribution function, respectively [14].
For any pre-fixed values of p0, p1, α, and β, we can enumerate the candidate designs with different (n1, PETS1, EN) combinations, where EN is the expected sample size,., i.e.,
An optimal design is considered to minimize the expected sample size. Alternatively, a minimax design minimizes the maximum sample size n = n1 + n2, amongst these candidates designs. If there is more than one single candidate design with smallest n, the one with the smallest ENS (under null hypothesis) is chosen within all the possible minimax designs.
Fleming’s two-stage design
Unlike Simon’s two-stage design, Fleming’s design additionally allows early trial termination due to high successful response rate [8]. In Fleming’s two-stage design, one more character, a1, is required and it denotes a threshold of acceptance point (under H0) in the first stage. A single-arm two stage trial with both futility (a1) and superiority (r1) values in the first stage and a rejection value (r) in the second stage are described in Fig. 2.

Flowchart for Fleming’s two-stage design
Based on Fleming’s two-stage design, the probability of rejecting the treatment is
where suffix F is used to represent the results of Fleming’s design [14]. The probability of early termination (PET) at the end of first stage (under H0) is
Thus, the expected sample size (EN) is
Although Fleming’s design ensures sample sizes no larger than the single-stage design, a limitation is that calculated critical values for accepting and rejecting the null hypothesis are based on pre-fixed sample sizes at stage 1 (n1) and stage 2 (n2), which may be undesirable for investigating and planning optimal designs. To remedy, Mander and Thompson extended Simon’s optimal and minimax criteria in Fleming’s two-stage design [10]. Such design will benefit from stopping early for either futility or efficacy, while preserve its simplicity and the small sample size.
Admissible design
Very often, the minimax design has a much smaller maximum sample size n than that of the optimal design, but it has an excessively large expected sample size EN. Similarly, optimal design requires a much smaller EN, but it suffers a considerably larger n as compares to the minimax design. In planning a phase II trial, we usually find ourselves in a dilemma when we must consider choosing one of the two designs by comparing the expected sample size and maximum sample size.
To overcome, it is desirable to search for a design between the optimal design and the minimax design such that it has EN close to that of the optimal design and n close to that of the minimax design. Jung et al. proposed an admissible adaptive design based on a Bayesian decision-theoretic criterion to compromise between EN and n [12, 13]. A design is called candidate design if it minimizes EN for a given n while satisfying the (α, β)-constraint. For pre-specified (p0, p1, α, β), let R denotes the space of all candidate designs satisfying the (α, β)-constraint, with n no more than an achievable accrued number of subjects N during the study period. For any given design d ∈ R, we consider its two outcomes n(d) in minimax design or EN(d) in optimal design. Let Q be a probability distribution defined over {n(d), EN(d)} as Q(n(d)) = q and Q(EN(d)) = 1-q, where q ∈ [0, 1].
Thus, for any design d ∈ R, the expected loss can be defined as
and the Bayes risk is defined as
Any design d ∈ R whose risk equals to the Bayes risk would be regarded as Bayes design, which will then be defined as admissible design against distribution Q. Note that q ∈ [0, 1] reflects the relative importance between maximum sample size and expected sample size in designing a phase II study. Thus, the minimax design is a special Bayes design with q = 1 and optimal design is a special Bayes design with q = 0. Conversely, for any q ∈ [0, 1], if no Bayes risk fits any design d ∈ R, the design would be defined as inadmissible.
Jung et al. [13] firstly proposed to apply admissible design to Simon’s two-stage design. In this article, we extend such admissible design to Fleming’s two-stage design, too.
Results
To compare the performance of optimal, minimax, and admissible design in Simon’s and Fleming’s two-stage design, the effect difference “p1-p0” are set to be 0.2 for p0 = 0.05, 0.10 and 0.30, and type I & II error constraints “(α, β)” vary across (0.10, 0.10), (0.05, 0.20) and (0.05, 0.10), respectively. These values are appeared in both Simon’s and Fleming’s two-stage design papers and are more representative to show sufficient promise to justify a definitive evaluation [15,16,17]. We calculate the true type I error and power (αT, 1-βT), sample size required in the first stage (n1), threshold values (a1, r1) for early termination, PET1, maximum sample size (n), threshold value (r) in the second stage, EN and the probability range (q) when each design is regarded as a good Bayes design.
Based on Simon’s two-stage design, Table 1 displays the optimal, minimax and admissible designs with pre-specified design parameters under H0. For each parameter setting of (p0, p1) and (α, β), the EN is much smaller than n. It is not difficult to find that the maximum sample size n of admissible design is smaller than optimal design but larger than minimax. Meanwhile, the expected samples size EN of admissible design is smaller than minimax design but larger than optimal design. Taking (p0, p1, α, β) = (0.05, 0.25, 0.05, 0.10) for example. In optimal design, the number of subjects required in the first stage is 9. Trials will be early terminated if no more than one response is seen in this stage. Otherwise another 21 subjects would be further enrolled, thus the maximum sample size reaches 30 at the end of the trial. The expected sample size is 16.8 and the probability of early termination is 0.630. Two admissible designs are given here, where n and EN are (28, 17.2) when q lies between 0.167 ~ 0.375, and (26, 18.4) when q lies between 0.375 ~ 0.667, respectively. For minimax design, the required maximum sample size is 25, which is five fewer than that of optimal design; while the expected sample size is 20.4, which is obviously larger than that of optimal design. A plot of EN against maximum sample size under this setting is illustrated in Fig. 3. The first and last dots are minimax and optimal design, respectively. Two identified Bayes candidate designs within this range are marked as “admissible”. Note, however, that some candidate designs (second and fourth design under (p0, p1, α, β) = (0.05, 0.25, 0.05, 0.10)) cannot reach Bayes risk, since their loss functions are not competitive (cannot get smaller value) over other designs for any value of q between [0, 1]. Such designs are symbolized as “inadmissible” in our study. In other words, such “in admissible” design may NOT be regarded as a good one according to a Bayesian decision-theoretic criterion, even though both sample size and EN are still deterministic given (p0, p1, α, β).

Minimax, admissible and optimal design for (p0, p1, α, β) = (0.05, 0.25, 0.05, 0.10) based on Simon’s design
Based on Fleming’s two stage design, Table 2 displays the results of all three designs with pre-defined design parameters under H0. Similar to findings in Simon’s design, minimax design requires least n than that of the admissible design, and optimal design has the largest n. On the other hand, optimal design has the least EN as compare to minimax design, while admissible design provides a compromised EN between Fleming’s two designs. For example, when p0 = 0.05, p1 = 0.25, α = 0.05 and β = 0.10, trials will be early terminated if no more than one response is seen in the first stage. However, once > 4 responses are seen in this stage, trials will also be terminated early due to efficacy. Otherwise another 21 subjects will be enrolled and the maximum sample size becomes 30. The expected sample size is 16.8 and the probability of early termination is 0.631. One admissible designs is identified. n and EN are (26, 17.2) when q lies between 0.091 ~ 0.565. Figure 4 shows the expected sample sizes under H0 over a range of values for n. The plot starts with Fleming’s minimax design and ends with Fleming’s optimal design. Two admissible designs are highlighted in this range.

Minimax, admissible and optimal design for (p0, p1, α, β) = (0.05, 0.25, 0.05, 0.10) based on Fleming’s design
In general, for pre-specific design parameter (p0, p1, α, β), Fleming’s two-stage design requires fewer maximum sample size and expected sample size than Simon’s. It is noteworthy that under certain criteria defined by design parameters, such as (p0, p1, α, β) = (0.05, 0.25, 0.05, 0.20), no additional admissible design can be identified. In this case, only optimal and minimax designs can routinely be considered. In this paper, parameter setting (α, β) = (0.05, 0.2) gives the most desirable sample sizes. For (p0, p1), the required n and EN remain the least in (0.05, 0.25), gradually increase in (0.10, 0.30), and attain the most in (0.30, 0.50).
A practical example
Schiller et al. [18] published a single-arm phase II clinical trial of Axitinib for patients with advanced non-small-cell lung cancer, and objective remission rate (ORR) was used as primary endpoint to evaluate efficacy. The parameter setting (p0, p1, α, β), in this trial, were specified to be (0.05, 0.2, 0.1, 0.1).
As listed in Table 3, sample size is estimated for optimal, admissible and minimax design based on Simon’s and Fleming’s two-stage design. In Simon’s design, 12 and 37 subjects are thought to be needed in the first stage and during the whole experiment for optimal design, respectively. If no response is observed in the first stage, the trial would be early terminated due to inefficacy. The number of subjects needed for minimax design in stage I and whole trial is 18 and 32 respectively. Two admissible designs’ with compromised sample sizes lie between these two designs are also listed in the table.
In Fleming’s design, minimax design requires 18 subjects in the first stage and once one or more responses are observed after the treatment, experiment proceeds to second stage and another 13 patients will be enrolled. During the first stage, however, the trial will also be considered early termination for efficacy, if 3 or more patients’ conditions are ameliorated. At second stage, if total 4 and more positive responses are found, phase II clinical trial will be claimed to be successful and further trial will be considered. Two admissible designs are identified, with q ∈ [0.091, 0.268] and [0.268, 0.444], respectively. For optimal design, the number of subjects required in the first and second (if necessary) design is 12 and 25, separately. Obviously, Fleming’s designs show considerably smaller maximum sample size and expected sample size than Simon’s, given a high probability of early termination for futility as well as efficacy.
Discussion
Simon’s two-stage design has been widely used in phase II clinical oncology trials for testing the efficacy of a single treatment regimen. The original design, however, only considers stopping for futility. Alternatively, Fleming’s design lends additional flexibility of allowing early termination by accepting the treatment regimen when initial results are extremely favorable. As a result, pharmaceutical reagents with outstanding efficacy can be early marketed, and patients can thus benefit from them. What’s more, k-stage (k ≥ 3) designs have also been proposed [8, 19, 20]. There are concerns that in practice, if the accrual is not fast, or if excessive initial failures occurs at first stage, k-stage designs are essentially the same as two-stage designs and will not be recommended. Thus, in this article, only two-stage design is considered. Nevertheless, further exploration is still needed in multi-stage design to ensure the successful development of effective cancer treatment.
In this paper, we compare the required sample size (n1, n), threshold values (a1, r1, r) for early termination, EN and the probability range (q) for minimax, optimal and admissible criteria in Simon and Fleming’s two-stage designs. It is often the case that maximum sample size of the optimal design is much larger than that of the minimax design, although the optimal design has the smallest expected sample size. Admissible designs are compromises between the minmax and the optimal designs. In addition, the optimal design always requires the smallest sample size in the first stage. We consider this as an important advantage of the optimal design to reduce the expected sample size as compared to other designs due to larger probability of early termination in the first stage. Thus, in clinical trial setting, optimal design may be more favorable when early data support drug ineffectiveness. This can reduce risk of exposing inactive treatments on patients, since the treatment regimen would be stopped timely once it shows low response activity. On the other hand, the minimax design required smallest maximum sample size, though this comes at the cost of larger sample size under the null hypothesis. Therefore, minimax design will be preferable if evidence agents reveals impressive therapeutic efficacy. This becomes more obvious in the consideration of the Fleming’s design. In practice, an investigator may also desire to add clinically meaningful constraint to (p0, p1) as a prior. In this case, it is better to explore in the possible ranges of q, and determine whether admissible design is more appropriate. Mander et al. [21] proposed a new admissible criterion by considering a more general expected loss function that includes the expected sample size under both null and alternative hypotheses and the maximum sample size. Their paper also additionally considered designs that can allow stopping for both efficacy and futility. We realized that our paper is considered as a subset of their comparisons provided no weight given to the expected sample size under alternative hypothesis. However, their triangular graph is not easily exemplifying the inadmissible designs among all candidate admissible designs. Our paper showed that the boundary line between admissible designs can still include a handful of designs that are not admissible for each set of design parameters. In addition, we are able to visually display all candidate designs between the minimax and the optimal designs in Simon’s and Fleming’s two-stage design. Our presented results further corroborated that inadmissible designs may not exist if the difference in maximum sample size between two Simon’s designs is less than or equal to 1 [22] or it is not on the concave hull [23]. Therefore, we consider both of our extensive tabulation and graphical method as important advantages to guide investigators to find the preferable design under the null hypothesis is true.
We revisit a single-arm phase II clinical trial of Axitinib for patients with advanced non-small-cell lung cancer [24]. Both optimal, minimax and admissible designs under Simon’s and Fleming’s design are used to attain 90% power at the significance level of 0.1. In this practical example, the ENs for three designs can be described as minimax design > admissible design > optimal design. Meanwhile, Fleming’s design always requires equal or smaller maximum sample size and expected sample size than Simon’s. This is due to the fact that Fleming’s design has the largest probability to reject further study of drugs either with novel efficacy or gloomy activity during early stage. Therefore, when accruing patients is difficult, or the study drug is costly, Fleming’s design can be a more appropriate choice. Oftentimes, two-stage design has definitive criterions for early termination, thus it can prevent subjects from continuously receiving treatment with unsatisfying efficacy. In addition, two-stage design receives popularity because of its comprehensible concept and convenient implementation. Thus, various methodological developments of this design are still expanded in many ways. For example, in some trials, even though the number of responses has exceeded threshold value r, the experiment will not be stopped early, but be continued to achieve enough cases for estimating confidence interval of effective rate [20].
In trials with two-stage designs, errors are inevitable no matter whether the trial is early terminated or not. If the experiment is recommended to move forward at the end of first stage, the probability of making type I error can’t be ignored (namely, false positive, meaning patients continuously take inactive drugs by error). Oppositely, type II error will be inflated once the trial is early stopped (namely, false negative, meaning patients might stop taking drugs with favorable efficacy) [25]. Obviously, the error of false negative is considered more serious because drugs may lose the chance of being further investigated once rejected. Though various designs have been put forward, more research is needed to precisely reduce the probability of false negative. For example, some oncology drug will still be presumed convincingly active despite of insufficient response rate, as long as it performs well in keeping disease stabilization. In this condition, like what Kunz and Kieser [26] have done in single-arm phase II oncology trials, we could consider using test with two binary endpoints instead of conventional one endpoint.
Conclusion
When the (p0, p1) could be estimated accurately, it is better to explore in the range of q, and determine which design to choose. Optimal design is preferable on drugs with limited efficacy. Minimax design is favorable on agents with impressive efficacy. For trials whose subjects are difficult to recruit or investigated drug is relatively expensive, Fleming’s design can be a better choice, compared to Simon’s design.
Availability of data and materials
Not applicable.
Abbreviations
- SA-II:
-
single-arm phase
- RP-II:
-
randomized phase II
- EN :
-
expected sample size
- PET :
-
probability of early termination
References
Gan HK, Grothey A, Pond GR, Moore MJ, Siu LL, Sargent D. Randomized phase II trials: inevitable or inadvisable? J Clin Oncol. 2010;28:2641–7.
Simon R. Optimal two-stage designs for phase II clinical trials. Control Clin Trials. 1989;10:1–10.
Sharma MR, Stadler WM, Ratain MJ. Randomized phase II trials: a long-term investment with promising returns. J Natl Cancer Inst. 2011;103:1093–100.
Shan GG, Zhang H, Jiang T. Minimax and admissible adaptive two-stage designs in phase II clinical trials. BMC Med Res Methodol. 2016;16:1–14.
Shan GG, Zhang H, Jiang T. Efficient confidence limits for adaptive one-arm two-stage clinical trials with binary endpoints. BMC Med Res Methodol. 2017;17:1–11.
Jung S-H, Sargent DJ. Randomized phase II clinical trials. J Biopharm Stat. 2014;24:802–16.
Khan I, Sarker SJ, Hackshaw A. Smaller sample sizes for phase II trials based on exact tests with actual error rates by trading-off their nominal levels of significance and power. Br J Cancer. 2012;107:1801–9.
Fleming TR. One-sample multiple testing procedure for phase II clinical trials. Biometrics. 1982;38:143–51.
Wason JM, Jaki T. A review of statistical designs for improving the efficiency of phase II studies in oncology. Stat Methods Med Res. 2016;25:1010–21.
Mander AP, Thompson SG. Two-stage designs optimal under the alternative hypothesis for phase II cancer clinical trials. Contemp Clin Trials. 2010;31:572–8.
Shuster J. Optimal two-stage designs for single arm phase II cancer trials. J Biopharm Stat. 2002;12:39–51.
Jung SH, Lee T, Kim K, George SL. Admissible two-stage designs for phase II cancer clinical trials. Stat Med. 2004;23:561–9.
Jung SH, Carey M, Kim KM. Graphical search for two-stage designs for phase II clinical trials. Control Clin Trials. 2001;22:367–72.
McPherson K, Colton T, et al. J Am Stat Assoc. 1976;71:80–6.
Lee JJ, Feng L. Randomized phase II designs in cancer clinical trials: current status and future directions. J Clin Oncol. 2005;23:4450–7.
Vickers AJ, Ballen V, Scher HI. Setting the bar in phase II trials: the use of historical data for determining “go/no go” decision for definitive phase III testing. Clin Cancer Res. 2007;13:972–6.
Brown SR, Gregory WM, Twelves CJ, Buyse M, Collinson F, Parmar M, et al. Designing phase II trials in cancer: a systematic review and guidance. Br J Cancer. 2011;105:194–9.
Schiller JH, Larson T, Ou SH, Limentani S, Sandler A, Vokes E, et al. Efficacy and safety of axitinib in patients with advanced non-small-cell lung cancer: results from a phase II study. J Clin Oncol. 2009;27:3836–41.
Chen TT. Optimal three-stage designs for phase II cancer clinical trials. Stat Med. 1997;16:2701–11.
Thatcher AR. Relationships between Bayesian and confidence limits for predictions. J R Stat Soc B. 1964;26:176–210.
Mander AP, Wason JM, Sweeting MJ, Thompson SG. Admissible two-stage designs for phase II cancer clinical trials that incorporate the expected sample size under the alternative hypothesis. Pharm Stat. 2012;11:91–6.
Kim J, Schell MJ. Modified Simon’s minimax and optimal two-stage designs for single-arm phase II cancer clinical trials. Oncotarget. 2019;10:4255–61 http://0-www-ncbi-nlm-nih-gov.brum.beds.ac.uk/pubmed/31303960.
DeGroot MH. Optimal statistical decisions. New York; 1970.
Ensign LG, Gehan EA, Kamen DS, Thall PF. An optimal three-stage design for phase II clinical trials. Stat Med. 1994;13:1727–36.
Jennison C, Turnbull BW. Confidence intervals for a binomail parameter parameter following a multistage test with application to MSL-STD 105D and medical trials. Technometrics. 1983;25:49–58.
Kunz CU, Kieser M. Optimal two-stage designs for single-arm phase II oncology trials with two binary endpoints. Methods Inf Med. 2011;50:372–7.
Acknowledgements
Not applicable.
Funding
The work was supported by grant from the National Natural Science Foundation of China (81773554 to H. Yu), and the National Natural Science Foundation of China Grant for Young Scientists (81302512 to J Bai). The funding body did not have any role in the design of the study and collection, analysis, and interpretation of data and in writing the manuscript.
Author information
Authors and Affiliations
Contributions
FQ, JLB and HY designed the research and wrote the manuscript; HY provided financial support; FQ, JWW, FC, JLB and HY analyzed and interpreted data; JWW, YZ, YYW and ZWJ assisted with design, data analysis and writing of the manuscript. All authors read and approved the final manuscript.
Corresponding authors
Ethics declarations
Ethics approval and consent to participate
Not applicable.
Consent for publication
Not applicable.
Competing interests
The authors declare that they have no competing interests.
Additional information
Publisher’s Note
Springer Nature remains neutral with regard to jurisdictional claims in published maps and institutional affiliations.
Rights and permissions
Open Access This article is licensed under a Creative Commons Attribution 4.0 International License, which permits use, sharing, adaptation, distribution and reproduction in any medium or format, as long as you give appropriate credit to the original author(s) and the source, provide a link to the Creative Commons licence, and indicate if changes were made. The images or other third party material in this article are included in the article's Creative Commons licence, unless indicated otherwise in a credit line to the material. If material is not included in the article's Creative Commons licence and your intended use is not permitted by statutory regulation or exceeds the permitted use, you will need to obtain permission directly from the copyright holder. To view a copy of this licence, visit http://creativecommons.org/licenses/by/4.0/. The Creative Commons Public Domain Dedication waiver (http://creativecommons.org/publicdomain/zero/1.0/) applies to the data made available in this article, unless otherwise stated in a credit line to the data.
About this article

Cite this article
Qin, F., Wu, J., Chen, F. et al. Optimal, minimax and admissible two-stage design for phase II oncology clinical trials. BMC Med Res Methodol 20, 126 (2020). https://0-doi-org.brum.beds.ac.uk/10.1186/s12874-020-01017-8
Received:
Accepted:
Published:
DOI: https://0-doi-org.brum.beds.ac.uk/10.1186/s12874-020-01017-8